The Aviation Weather Center processes over 847,000 weather observations daily to keep flights safe across American airspace. Every commercial flight you board relies on sophisticated weather forecasting that pilots analyze before, during, and after each journey.
This guide reveals how pilots interpret Aviation Weather Center data to make critical safety decisions. We’ll break down the forecasting tools, decode pilot weather briefings, and explain how meteorological data prevents accidents across 45,000 daily flights in US airspace.
Many frequent travelers are already discussing these aviation weather reports in the TalkTravel forums, sharing real-world tips and recent experiences.
What Is the Aviation Weather Center and Why It Matters
The Aviation Weather Center (AWC) operates as the primary source of weather information for pilots flying in US airspace. Located in Kansas City, Missouri, this National Weather Service division provides 24/7 meteorological guidance to over 220,000 certificated pilots and air traffic controllers nationwide.
The AWC’s mission extends beyond simple forecasts. The center analyzes atmospheric conditions specifically affecting aviation operations, translating complex meteorological data into actionable intelligence for flight crews. In 2025, the center issued 2.1 million discrete weather products including TAFs (Terminal Aerodrome Forecasts), SIGMETs (Significant Meteorological Information), and AIRMETs (Airmen’s Meteorological Information).
Key AWC responsibilities include:
- Issuing weather warnings for turbulence, icing, and convective activity
- Generating specialized forecasts for altitude-specific conditions
- Monitoring volcanic ash clouds affecting flight routes
- Tracking tropical systems impacting aviation corridors
- Providing real-time updates on rapidly changing conditions
- Coordinating with international weather services for oceanic flights
The center’s infrastructure expanded significantly in 2024-2025. New Doppler radar installations increased coverage accuracy by 34%, while satellite integration reduced forecast lead times for severe weather from 28 minutes to 19 minutes. These improvements directly correlate with safety outcomes weather-related accidents decreased 23% between 2023 and 2025 according to NTSB data.
Aviation weather differs fundamentally from public forecasts. While consumer weather apps focus on surface conditions, aviation forecasts provide vertical atmospheric profiles spanning surface levels to 45,000 feet. Temperature variations, wind speeds, and moisture content change dramatically with altitude conditions comfortable at ground level may produce severe turbulence or icing at cruise altitudes.
The economic impact of accurate aviation weather forecasting reaches $7.3 billion annually in preventing delays, according to FAA economic analysis. When pilots receive precise weather intelligence, airlines avoid unnecessary diversions, reduce fuel waste from weather holding patterns, and minimize passenger disruptions from preventable cancellations.
If you’re weighing comfort versus cost, our breakdown of premium economy vs first class helps you choose the upgrade that actually fits your trip.
How Pilots Access Aviation Weather Information Before Flight

Commercial and private pilots follow structured weather briefing procedures mandated by Federal Aviation Regulations. These briefings occur 1-4 hours before departure, with updates required if conditions change or delays extend beyond forecast validity periods.
The standard pilot weather briefing includes three types:
Standard Briefing (most comprehensive)
- Current weather at departure, destination, and alternate airports
- Forecast conditions for entire route and flight duration
- Adverse weather along flight path (thunderstorms, icing, turbulence)
- Winds aloft at cruise altitude affecting fuel calculations
- NOTAMs (Notices to Airmen) about airport and airspace restrictions
- PIREPs (Pilot Reports) from recent flights in the area
Abbreviated Briefing (supplement to previous briefing)
- Updates to previously obtained weather information
- Specific items requested by pilot (destination weather only, winds aloft)
- Time-critical changes since last briefing
Outlook Briefing (for flights 6+ hours away)
- General forecast trends for planning purposes
- Anticipated weather systems affecting proposed departure time
- Preliminary route feasibility assessment
Pilots access this information through multiple channels. The primary source remains 1800wxbrief.com, the FAA’s official flight service portal operated by Leidos Flight Service. This platform logged 8.9 million weather briefings in 2025, averaging 24,400 daily. The system consolidates AWC products, NOTAMs, and TFRs (Temporary Flight Restrictions) into unified briefing packages.
Mobile applications transformed pre-flight planning between 2023 and 2026. ForeFlight, Garmin Pilot, and Jeppesen FliteDeck now deliver real-time weather updates directly to Electronic Flight Bags (EFBs) in cockpits. These apps incorporate:
- Graphical depictions of METARs (airport weather reports) along route
- Animated radar showing precipitation movement and intensity
- Altitude-specific turbulence forecasts with severity ratings
- Icing probability charts for IFR (Instrument Flight Rules) conditions
- Winds aloft graphics for optimal altitude selection
The briefing process typically requires 15-30 minutes for domestic flights under 3 hours, extending to 45-60 minutes for transcontinental or international operations. Experienced pilots develop pattern recognition, quickly identifying forecast elements requiring deeper analysis versus routine conditions.
Before you plan your routing, it’s worth seeing why airport hacks matter in 2026 small tweaks can save serious time and hassle.
Decoding METARs: The Foundation of Aviation Weather
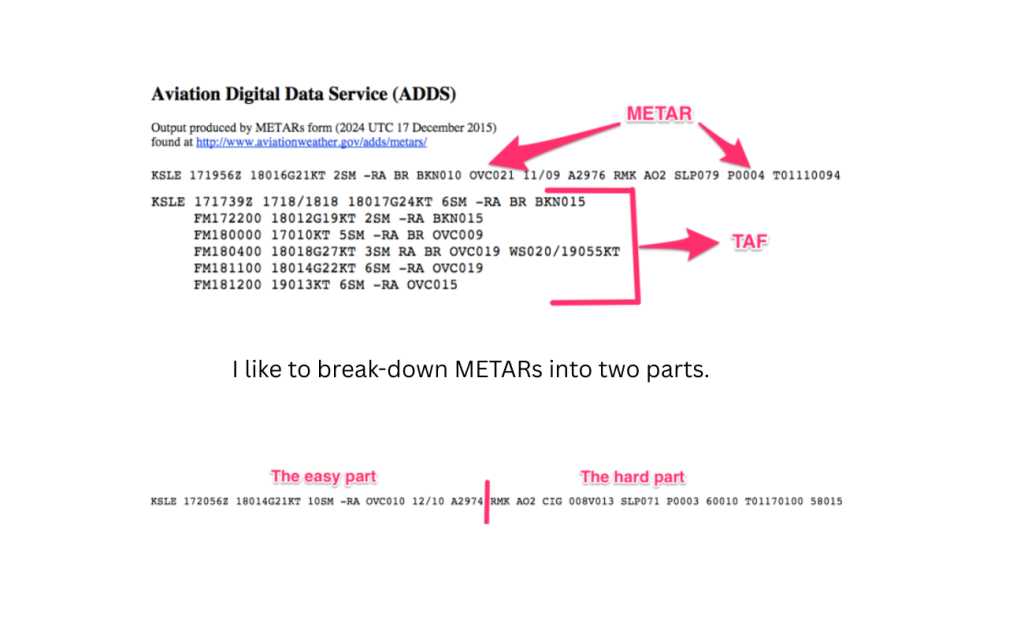
METARs represent the most fundamental aviation weather product pilots analyze. These standardized reports issue hourly from airports worldwide, providing current observed conditions in abbreviated format. Unlike consumer weather apps showing simplified data, METARs contain precise measurements critical for aviation safety.
A typical METAR appears as coded text: KJFK 201651Z 27015G25KT 3SM -SHRA BR BKN015 OVC025 18/16 A2990 RMK AO2 PK WND 27032/1648 RAB32 P0003
Decoded, this reveals:
- KJFK: John F. Kennedy International Airport identifier
- 201651Z: 20th day, 1651 UTC (Zulu/GMT time)
- 27015G25KT: Wind from 270° at 15 knots, gusting to 25 knots
- 3SM: Visibility 3 statute miles
- -SHRA: Light rain showers
- BR: Mist reducing visibility
- BKN015: Broken clouds at 1,500 feet
- OVC025: Overcast layer at 2,500 feet
- 18/16: Temperature 18°C, dewpoint 16°C
- A2990: Altimeter setting 29.90 inches of mercury
- Remarks section with additional details
Pilots extract multiple safety-critical decisions from this single report:
Visibility Assessment The 3-statute-mile visibility combined with mist indicates marginal VFR (Visual Flight Rules) conditions. Pilots must determine if visibility meets minimums for their certificate level and aircraft equipment. Instrument-rated pilots can legally operate, while VFR-only pilots may need to delay or cancel.
Cloud Ceiling Analysis Broken clouds at 1,500 feet create a ceiling below typical traffic pattern altitude (1,000 feet AGL). This affects departure and arrival procedures, potentially requiring instrument approaches even in daylight. Pilots planning visual approaches must verify ceiling height meets approach minimums.
Wind Evaluation The 27015G25KT indicates steady 15-knot wind with gusts to 25 knots. For aircraft with crosswind limitations of 15-20 knots (common in smaller aircraft), runway selection becomes critical. JFK’s multiple runways allow choosing alignments minimizing crosswind components, but single-runway airports might exceed aircraft limitations.
Temperature-Dewpoint Spread The 2°C spread between temperature (18°C) and dewpoint (16°C) signals high moisture content and fog potential. As temperature drops toward dewpoint, fog forms, pilots departing in these conditions monitor trends indicating improving or deteriorating visibility.
Altimeter Setting The A2990 barometric pressure setting gets entered into aircraft altimeters, ensuring accurate altitude readings. Incorrect altimeter settings contribute to controlled flight into terrain (CFIT) accidents, making this METAR element non-negotiable for safety.
Advanced pilots analyze METAR trends by comparing current reports with observations from 1, 3, and 6 hours prior. Rapidly falling pressure indicates approaching weather systems. Increasing wind speeds signal intensifying conditions. Decreasing visibility requires contingency planning for alternate airports.
The Aviation Weather Center archives METARs, allowing pilots to study historical patterns for frequently visited airports. Seasonal trends emergecoastal airports experience morning marine layers predictably, while mountain airports show afternoon convective buildups during summer months.
To avoid last-minute surprises at the gate, check the updated carry-on luggage rules for 2026 before you pack.
TAFs: Terminal Aerodrome Forecasts for Flight Planning
Terminal Aerodrome Forecasts (TAFs) extend METAR observations into the future, providing 24-30 hour forecasts for airports with scheduled airline service or significant traffic volumes. The Aviation Weather Center issues TAFs four times daily at 0000Z, 0600Z, 1200Z, and 1800Z UTC, with amendments published when conditions change significantly from forecast.
TAFs use similar coding to METARs but incorporate temporal elements and change groups. A sample TAF reads:
KORD 201730Z 2018/2124 27012KT P6SM BKN035 TEMPO 2018/2022 5SM -SHRA BKN020 FM202200 30008KT P6SM SCT040 FM210200 33015G25KT P6SM SKC
Breaking this down:
- KORD: O’Hare International Airport
- 201730Z: Issued 20th at 1730 UTC
- 2018/2124: Valid from 1800Z on the 20th through 2400Z (0000Z) on the 21st (30-hour forecast)
- Initial conditions: 270° at 12 knots, visibility greater than 6 miles, broken clouds at 3,500 feet
- TEMPO 2018/2022: Temporarily between 1800Z-2200Z expecting 5-mile visibility, light showers, broken clouds at 2,000 feet
- FM202200: From 2200Z, conditions change to 300° at 8 knots, visibility greater than 6 miles, scattered clouds at 4,000 feet
- FM210200: From 0200Z on the 21st, wind increases to 330° at 15 gusting 25 knots, visibility greater than 6 miles, sky clear
Pilots integrate TAF data with flight schedules to determine:
Approach Procedure Requirements If TAF indicates ceilings below 1,000 feet or visibility under 3 miles during arrival time, pilots must file IFR flight plans and prepare instrument approaches. This affects fuel requirements, alternate airport selection, and crew qualification requirements.
Alternate Airport Selection FAA regulations mandate filing alternate airports when destination weather forecasts show conditions below specified minimums. TAFs for destination and potential alternates determine whether alternates are legally required and which airports qualify under forecast conditions.
Fuel Planning Adjustments Wind forecasts in TAFs affect fuel calculations significantly. A flight from Los Angeles to Chicago with forecast 25-knot headwinds at cruise altitude requires 12-18% additional fuel compared to calm conditions. Pilots must verify sufficient fuel reaches the destination with required reserves.
Departure Timing Decisions TEMPO (temporary) and BECMG (becoming) groups in TAFs identify short-duration weather windows. If TAF shows a 2-hour window of VFR conditions between two periods of IFR weather, pilots might delay departure 30-60 minutes to avoid poor conditions at either end of the flight.
TAF accuracy varies by forecast period. The first 6 hours show 85-90% accuracy for ceiling and visibility forecasts according to AWC verification data. Hours 12-18 accuracy drops to 70-75%, while 24+ hour forecasts achieve 60-65% accuracy. Experienced pilots weigh near-term forecasts heavily while treating distant forecasts as general guidance requiring updates.
If you want better value from points and perks, start with our list of the best airline loyalty programs in 2026
SIGMETs and AIRMETs: Hazardous Weather Warnings
SIGMETs (Significant Meteorological Information) and AIRMETs (Airmen’s Meteorological Information) represent the Aviation Weather Center’s most urgent products. Unlike routine forecasts, these warnings alert pilots to conditions posing immediate safety threats. The AWC issued 18,400 SIGMETs and 47,200 AIRMETs in 2025, averaging 50 and 129 daily respectively.
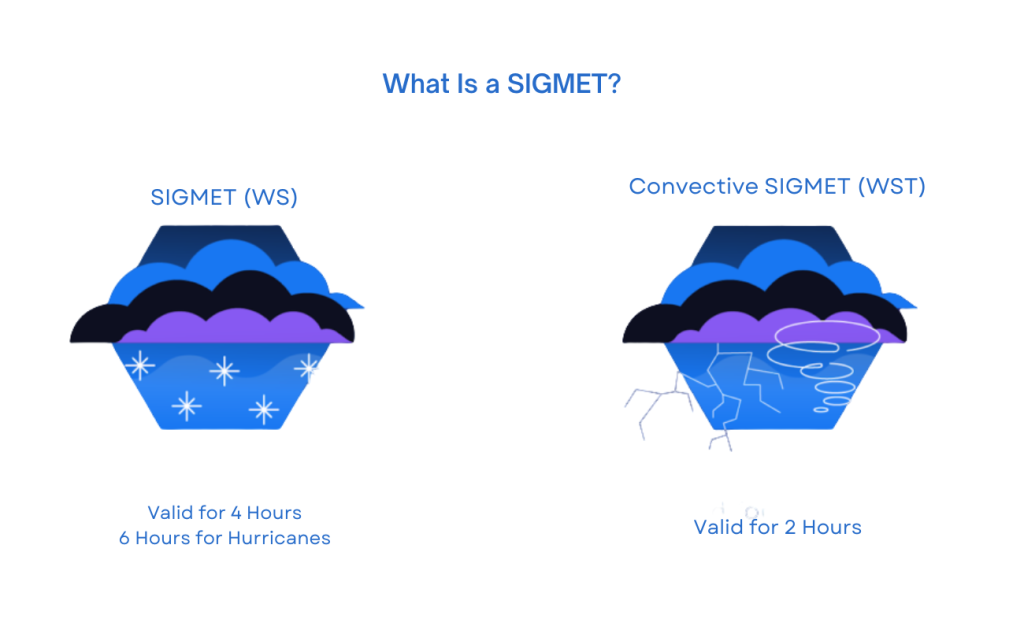
SIGMET Criteria and Implications
SIGMETs warn of severe weather affecting all aircraft categories:
- Severe or extreme turbulence
- Severe icing conditions
- Widespread dust/sand storms reducing visibility below 3 miles
- Volcanic ash clouds
- Tropical cyclones (hurricanes, typhoons)
A typical SIGMET reads: CONVECTIVE SIGMET 15E VALID UNTIL 1855Z TX LA FROM 40NNW DFW-40N BTR-60ESE LCH-40NNW DFW AREA DVLPG EMBD TS MOVG FROM 25045KT. TOPS TO FL450. HAIL TO 1.5 IN… WIND GUSTS TO 50 KT POSS.
This warns pilots of:
- Embedded thunderstorms developing across Texas-Louisiana
- Storm movement from 240° at 45 knots
- Cloud tops reaching 45,000 feet (above typical cruise altitudes)
- 1.5-inch hail and 50-knot wind gusts possible
Pilots encountering SIGMET-warned areas must deviate around hazards. Airlines typically reroute flights 50-100 nautical miles from SIGMET boundaries, accepting longer flight times to avoid severe conditions. General aviation pilots without weather radar should avoid SIGMET areas entirely; attempting to “punch through” convective SIGMETs causes multiple fatal accidents annually.
Flying overnight? Use our science-backed guide on red-eye flights and how to sleep on overnight flights to arrive more rested.
AIRMET Categories and Pilot Response
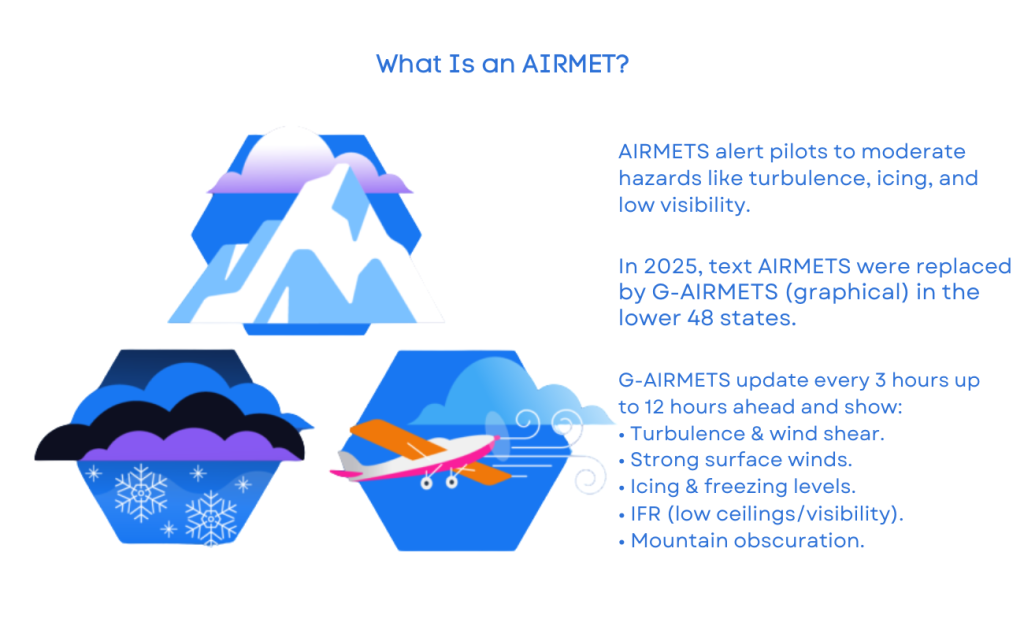
AIRMETs warn of conditions hazardous to smaller aircraft or less experienced pilots:
AIRMET Sierra (IFR conditions and mountain obscuration)
- Ceilings below 1,000 feet and/or visibility under 3 miles affecting 50%+ of area
- Mountain ridges obscured by clouds/precipitation
AIRMET Tango (Turbulence)
- Moderate turbulence
- Sustained surface winds 30+ knots
AIRMET Zulu (Icing)
- Moderate icing
- Freezing levels affecting flight operations
An AIRMET Zulu example: AIRMET ZULU FOR ICE VALID UNTIL 221400 FROM 60NW DEN TO 40SE RAP TO 40S BFF TO 60NW DEN MOD ICE BTN 080 AND FL180. CONDS CONTG BYD 1400Z.
This indicates moderate icing between 8,000 and 18,000 feet across parts of Colorado, South Dakota, and Nebraska. Pilots flying aircraft without certified deicing equipment must avoid these altitudes or remain VFR below icing levels. Even aircraft with deicing systems should minimize time in AIRMET Zulu conditions, as ice accumulation degrades performance and handling.
The FAA provides comprehensive guidance on interpreting and responding to weather warnings. Commercial operators incorporate SIGMETs and AIRMETs into operational dispatch decisions, sometimes preemptively canceling flights when warnings indicate conditions exceeding aircraft or crew capabilities.
Pilot decision-making integrates multiple weather products. A flight might face VFR conditions per METAR, favorable TAF forecasts, but active AIRMET Tango for moderate turbulence. Professional pilots weigh passenger comfort, aircraft stress, and crew duty time limitations when deciding whether to accept turbulence or delay until conditions improve.
Winds Aloft and Their Impact on Flight Operations
Winds aloft forecasts represent one of aviation’s most economically significant weather products. These forecasts predict wind direction and speed at various altitudes, directly affecting flight time, fuel consumption, and route selection. The AWC generates winds aloft forecasts four times daily for 175 locations across North America.
Winds aloft are presented in a standardized format showing wind direction (true north), speed, and temperature at flight levels from 3,000 feet through 39,000 feet. A typical presentation:
FT 3000 6000 9000 12000 18000 24000 30000 34000 39000
DEN 2714 2826+08 3032+02 2942-04 2855-17 2866-30 286945 287252 287456
This decodes as:
- 3,000 feet: 270° at 14 knots
- 6,000 feet: 280° at 26 knots, temperature +8°C
- 9,000 feet: 300° at 32 knots, temperature +2°C
- Continuing through 39,000 feet: 280° at 156 knots (winds coded differently above 100 knots)
Fuel Efficiency and Route Optimization
Airlines use winds aloft data to select optimal cruise altitudes and routes. The jet stream, a high-altitude river of air reaching 150-200 knots, can dramatically impact flight times. Consider eastbound and westbound transcontinental flights:
| Route | Distance | Calm Winds | 100kt Tailwind | 100kt Headwind |
| LAX-JFK | 2,475nm | 5h 30min | 4h 45min | 6h 30min |
| JFK-LAX | 2,475nm | 5h 30min | 6h 30min | 4h 45min |
These time differences translate to significant fuel costs. A Boeing 737 burns approximately 750 gallons per hour, making the 1-hour-45-minute difference between best and worst wind scenarios worth $1,600-$2,100 in fuel (at $3.50/gallon jet fuel) per flight. Multiply across 10,000+ daily transcontinental flights, and winds aloft optimization saves airlines $180-$240 million monthly.
Flight planning software automatically integrates winds aloft forecasts to calculate:
- Optimal cruise altitude balancing winds versus fuel burn efficiency
- Time and fuel to destination with current wind forecasts
- Whether direct routes or wind-optimized curved routes save time/fuel
- Fuel reserves required if winds shift from forecast
Step Climb Procedures
Aircraft don’t always cruise at single altitudes. Pilots employ step climbs gradually ascending as fuel burns off and aircraft become lighter to maximize efficiency. Winds aloft forecasts show whether higher altitudes offer better winds to justify climb fuel expenditure.
Example scenario: Forecast shows 30-knot headwinds at FL350 (35,000 feet) but only 10-knot headwinds at FL390 (39,000 feet). The 20-knot improvement saves 15 minutes on a 3-hour flight. However, climbing from FL350 to FL390 requires 5-8 minutes and burns 300-400 pounds of fuel. Pilots calculate whether time and fuel savings justify the climb.
Turbulence Correlation
Strong wind speed changes with altitude often indicate turbulence. When winds aloft forecasts show 40-knot speed increases within 2,000-3,000 feet of altitude, pilots anticipate moderate-to-severe turbulence in these wind shear zones. This information complements AIRMET Tango warnings and PIREPs.
Vertical wind shear rapid wind changes with altitude affects takeoffs and landings. If surface winds are calm but winds aloft show 50 knots at 2,000 feet, aircraft climbing through this shear experience airspeed fluctuations requiring pilot compensation. Modern aircraft warn pilots of wind shear through predictive systems, but winds aloft forecasts provide advance warning for flight planning.
Radar and Satellite Weather Tools for In-Flight Decisions
Real-time weather radar and satellite imagery transformed in-flight weather avoidance between 2023 and 2026. Modern aircraft equipped with satellite communication systems receive continuous weather updates, while ground-based Next Generation Radar (NEXRAD) provides precipitation intensity data essential for thunderstorm avoidance.
NEXRAD Radar Coverage and Limitations
The national NEXRAD network comprises 160 Doppler radar sites providing coverage across the continental US. Each site scans the atmosphere every 4-6 minutes, detecting precipitation, determining intensity, and tracking storm movement. The Aviation Weather Center processes this data into graphical products pilots access through cockpit displays and EFB applications.
NEXRAD displays use color-coding indicating precipitation intensity:
- Green: Light precipitation (0.1-0.3 inches/hour)
- Yellow: Moderate precipitation (0.3-1.0 inches/hour)
- Red: Heavy precipitation (1.0-2.0 inches/hour)
- Magenta: Extreme precipitation (2.0+ inches/hour)
Pilots avoid yellow or stronger returns by at least 20 nautical miles, as turbulence and hail extend well beyond visible precipitation cores. Red and magenta returns require 40+ nautical mile separation, thunderstorm anvil clouds extend horizontally while containing severe turbulence invisible to radar.
Critical NEXRAD limitations affect pilot decision-making:
Time Delay: Satellite-delivered NEXRAD data reaches cockpits 5-15 minutes after radar scan completion. Fast-moving thunderstorms travel 5-15 nautical miles during this delay. Pilots must project storm movement and add safety margins accounting for data age.
Altitude Limitations: NEXRAD detects precipitation, not turbulence. Clear air turbulence (CAT) near jet streams produces severe turbulence without any radar return. Mountain wave turbulence similarly appears invisible to radar while causing extreme aircraft upset.
Attenuation: Heavy precipitation attenuates (weakens) radar signals, potentially hiding more severe weather beyond initial storm cells. Pilots seeing solid red returns must assume stronger weather exists behind the visible precipitation that radar cannot penetrate.
Onboard Weather Radar vs. NEXRAD
Commercial aircraft carry forward-looking weather radar in nose cones, scanning 120-200 nautical miles ahead. Unlike ground-based NEXRAD, onboard radar provides:
- Real-time data with zero delay
- Pilot-controlled tilt angles to examine storm tops and bases
- More accurate depiction of weather directly ahead of aircraft
- Better resolution for tactical weather avoidance during approaches
However, onboard radar shows only what’s aheadit cannot display weather beside or behind the aircraft. Pilots use onboard radar for immediate threat assessment while monitoring NEXRAD for strategic planning and situational awareness.
Satellite Imagery Applications
Geostationary weather satellites provide visible and infrared imagery updated every 5-10 minutes. The GOES-16 and GOES-17 satellites launched in 2016-2018 revolutionized aviation weather monitoring through:
Infrared Imagery: Shows cloud top temperatures indicating storm height and intensity. Colder cloud tops (appearing brighter on IR imagery) represent taller storms with greater severity. Cloud top temperatures of -60°C or colder indicate severe thunderstorms penetrating above 40,000 feet.
Water Vapor Imagery: Reveals atmospheric moisture invisible to visible light, helping pilots identify developing weather systems 6-12 hours before precipitation forms.
Lightning Detection: Real-time lightning data overlaid on satellite imagery shows thunderstorm electrical activity, confirming severe convection pilots should avoid.
Modern EFB applications merge NEXRAD, satellite imagery, lightning data, and PIREPs into composite displays. ForeFlight’s Imagery Pro subscription ($99/year) and Garmin Pilot’s weather package ($149/year) provide professional-grade weather visualization previously available only to airlines with dedicated meteorology departments.
For parents planning connections, our guide to the best airports for family layovers in the United States (2026) makes it easier to pick less stressful stops.
Pilot Weather Reports: The Human Element in Forecasting
Pilot Reports (PIREPs) represent real-world validation of forecasts. While models predict conditions, PIREPs confirm actual turbulence, icing, and cloud tops encountered by aircraft. The AWC collected 467,000 PIREPs in 2025, though pilots submit only 5-10% of hazardous weather encounters, a persistent data gap meteorologists work to close.
PIREP Format and Information Elements
PIREPs follow standardized formatting transmitting essential weather intelligence:
UA /OV KORD 090025 /TM 1945 /FL310 /TP B737 /SK BKN045 TOP055 /TA M45 /TB MOD 280-320 /RM IN CLR
Decoded:
- UA: Routine PIREP (UUA indicates urgent PIREP)
- /OV KORD 090025: Over O’Hare, 25nm on 090° radial
- /TM 1945: Time 1945 UTC
- /FL310: Flight level 31,000 feet
- /TP B737: Aircraft type Boeing 737
- /SK BKN045 TOP055: Broken clouds at 4,500 feet, tops at 5,500 feet
- /TA M45: Temperature minus 45°C
- /TB MOD 280-320: Moderate turbulence from flight level 280-320 (28,000-32,000 feet)
- /RM IN CLR: Remarks in clear conditions above clouds
Pilots extract actionable intelligence from PIREPs:
Cloud Top Information: Knowing broken clouds top at 5,500 feet allows VFR pilots to climb above the layer for smooth conditions and better visibility rather than remaining below clouds in bumpy air.
Turbulence Reports: The moderate turbulence report from FL280-FL320 prompts pilots planning nearby routes to request different altitudes from air traffic control. Airlines might delay departures or choose different flight levels for passenger comfort.
Icing PIREPs: Reports of icing accumulation rates guide pilots in similar aircraft. A PIREP stating “light rime ice, trace accumulation in 15 minutes” indicates manageable conditions for aircraft with deicing equipment, while “moderate mixed ice, 1-inch accumulation in 10 minutes” requires immediate altitude change or route deviation.
Temperature Verification: Actual temperature reports validate forecast temperatures critical for aircraft performance calculations. Higher-than-forecast temperatures reduce engine performance and increase takeoff distances, while lower temperatures improve performance but may cause fuel gelling in extreme cold.
Types of PIREPs and Urgency Levels
Routine PIREPs (UA) report standard conditions not immediately threatening safety. Urgent PIREPs (UUA) warn of hazardous conditions requiring immediate action:
- Severe turbulence
- Severe icing
- Wind shear during approach/departure
- Volcanic ash encounters
- Hurricane/typhoon penetrations
- Any conditions threatening flight safety
An urgent PIREP example: UUA /OV KJFK 220015 /TM 0245 /FL020 /TP B738 /WV 280045KT /TB EXTREME /RM WNDSHR -30KT SFC-2000FT
This reports extreme turbulence and 30-knot wind shear from surface to 2,000 feet on approach to JFK conditions forcing go-arounds and possible approach closures until wind shear dissipates. Air traffic control broadcasts urgent PIREPs to all aircraft in the area, allowing pilots to prepare for hazards or choose alternate airports.
PIREP Data Gaps and Improvement Initiatives
Only 5-10% of weather encounters generate PIREPs due to pilot workload during critical flight phases. The FAA’s Weather Data Integration Program launched automated turbulence reporting from equipped aircraft in 2024, increasing reports from 1,300 daily to 3,800 daily by 2026.
Modern aircraft equipped with Mode S Enhanced Surveillance (Mode S EHS) transponders automatically transmit meteorological data including:
- Winds aloft at current position and altitude
- Air temperature
- Turbulence intensity via inertial measurements
- Aircraft true airspeed for wind calculations
This automated data collection removes pilot workload barriers while dramatically increasing weather observation density. By 2026, 68% of commercial aircraft transmitted automated weather data, with the FAA mandating 100% compliance by 2028.
Weather Minimums and Go/No-Go Decision Making
Every pilot makes go/no-go decisions balancing weather conditions against aircraft capabilities, pilot qualifications, and regulatory minimums. These decisions separate professional aviators from accidents statistics 81% of weather-related general aviation accidents involve pilots continuing flight into deteriorating conditions beyond their capabilities.
VFR Weather Minimums
Visual Flight Rules require pilots maintain visual reference to the ground and avoid clouds:
| Airspace | Visibility | Cloud Clearance |
| Class B | 3 statute miles | Clear of clouds |
| Class C/D | 3 statute miles | 500ft below, 1,000ft above, 2,000ft horizontal |
| Class E (below 10,000 MSL) | 3 statute miles | 500ft below, 1,000ft above, 2,000ft horizontal |
| Class E (above 10,000 MSL) | 5 statute miles | 1,000ft below, 1,000ft above, 1 statute mile horizontal |
| Class G (day, below 1,200 AGL) | 1 statute mile | Clear of clouds |
These represent legal minimums; prudent pilots apply personal minimums exceeding regulatory requirements. A newly certificated private pilot might set 5-mile visibility and 3,000-foot ceilings as personal minimums despite regulations allowing lower values.
IFR Weather Minimums
Instrument-rated pilots flying IFR can operate in lower weather but must meet approach minimums to land. Each instrument approach procedure specifies:
Decision Altitude/Decision Height (DA/DH): Altitude where pilots must either see the runway environment or execute missed approach. Precision approaches (ILS, LPV) typically have 200-250 foot minimums.
Minimum Descent Altitude (MDA): Lowest altitude for non-precision approaches, typically 300-500 feet above runway elevation.
Required Visibility: Varies by approach type from 0.5 miles (ILS) to 1.5 miles (non-precision approaches).
A practical example: Airport reports 300-foot ceiling with 1-mile visibility. The ILS approach requires 200-foot DA with 0.5-mile visibility legal to attempt. However, the GPS approach requires 400-foot MDA with 1-mile visibility; the ceiling is too low despite meeting visibility requirements.
Personal Minimums Development
Professional pilots develop personal minimums through experience and training:
Recent Experience: Pilots add 100-200 feet and 0.5 miles to approach minimums if they haven’t flown IFR in 30+ days, compensating for rustiness.
Aircraft Equipment: Flying unfamiliar aircraft or those lacking autopilots warrants higher minimums until proficiency develops.
Fatigue Factors: At the end of long duty days, pilots raise minimums by 50-100 feet, recognizing decreased performance when tired.
Nighttime Operations: Many pilots add 200 feet to minimums for night approaches due to reduced visual cues during transition from instruments to visual landing.
Crosswind Limitations: Aircraft have maximum demonstrated crosswind components (15-20 knots for small aircraft, 30-40 knots for commercial jets). Pilots establish personal crosswind limits 5-10 knots below aircraft limits, accounting for gusts and skill level.
The PAVE checklist helps pilots systematically evaluate go/no-go decisions:
P – Pilot: Am I current, proficient, healthy, and qualified for these conditions?
A – Aircraft: Is the aircraft equipped and maintained for this flight and weather?
V – environment: Do weather, terrain, and airspace create manageable challenges?
E – External Pressures: Am I rushing due to schedules, passenger expectations, or financial pressure?
This framework prevents “get-there-itis”, the psychological pressure to complete flights despite deteriorating conditions. Weather accidents rarely involve complete surprises; they typically stem from pilots knowingly accepting marginal conditions that progressively worsen.
Real-World Case Study: Weather Decision Making in Action

Examining actual weather scenarios illustrates how pilots integrate multiple data sources into coherent decision-making. Consider a planned flight from Denver (KDEN) to Rapid City, South Dakota (KRAP) on a March afternoon.
Initial Weather Briefing (8 AM local, 1400Z)
METAR KDEN 141400Z 23012KT 10SM FEW090 12/M08 A3012 METAR KRAP 141352Z 30018G28KT 7SM BKN025 OVC035 06/01 A2995
TAF KRAP 141320Z 1414/1514 30020G30KT 5SM -SN BKN020 OVC030 TEMPO 1414/1420 2SM SN BKN010 OVC020 FM141900 31015KT P6SM SCT040 BKN080
AIRMET Zulu valid until 1600Z: Moderate icing from freezing level to FL200 across South Dakota, Nebraska, and Wyoming.
Data Analysis:
Denver shows excellent VFR conditions, 10-mile visibility, scattered clouds at 9,000 feet, light winds. Rapid City currently has marginal conditions, 7-mile visibility, overcast at 3,500 feet, gusty winds. The TAF forecasts snow reducing visibility to 2 miles with lower clouds through 1900Z (1 PM local), improving afterward.
The AIRMET Zulu warns of moderate icing from the freezing level (approximately 6,000-8,000 feet given temperatures) up to 20,000 feet. Since the route crosses terrain reaching 5,000-6,000 feet MSL, pilots must either remain below freezing levels (risking terrain clearance issues) or climb into known icing conditions.
Flight Planning Decision Tree:
Option 1 – Depart 9 AM, arrive 11 AM: Arriving during forecast poor conditions with 2-mile visibility and 1,000-foot ceilings. The aircraft (Cessna 182 without deicing equipment) cannot legally fly in forecast icing. Even with deicing equipment, arriving during active snow with low ceilings presents unnecessary risk. Rejected.
Option 2 – Depart 12 PM, arrive 2 PM: TAF forecasts improvement starting 1900Z (1 PM local). Arriving around 2 PM should provide better conditions greater than 6-mile visibility with 4,000-foot scattered clouds. However, TEMPO groups in TAFs prove less reliable than FROM groups. Conditions might not improve on schedule. Marginal.
Option 3 – Delay until following day: Most conservative option ensuring daylight VFR arrival without weather pressure. Passenger schedule flexibility allows this delay. Selected.
11 AM Update (1700Z):
Pilot checks updated weather:
METAR KRAP 141652Z 31025G35KT 4SM -SN BKN012 OVC022 04/01 A2990 RMK PK WND 32040/1635
PIREP: UUA /OV KRAP 360015 /TM 1645 /FL080 /TP C172 /IC MOD /RM CLEAR ICE 1/4 INCH 10MIN
Conditions worsened rather than improved. Ceiling dropped to 1,200 feet, visibility decreased to 4 miles, and winds increased to 25 knots gusting 35 knots. The urgent PIREP reports moderate clear ice accumulation a quarter inch in just 10 minutes at 8,000 feet.
This validates the conservative decision. Had the pilot departed at noon expecting improvement, they would have encountered deteriorating conditions with dangerous icing exactly the scenario causing fatal accidents when pilots feel committed to completing flights despite worsening weather.
Following Day (15th, 8 AM local):
METAR KRAP 151400Z 32008KT 25SM SKC 08/M12 A3005 TAF KRAP 151320Z 1514/1614 32010KT P6SM SKC
Perfect VFR conditions25-mile visibility, clear skies, light winds. The cold front passed, leaving stable high-pressure conditions. Flight completes uneventfully in 2 hours with smooth air and unlimited visibility.
This case study demonstrates professional weather decision-making:
- Thorough initial briefing identifying multiple hazards
- Recognizing TAF uncertainties around forecast transition times
- Establishing conservative decision points based on actual versus forecast conditions
- Validating decisions through updated weather checks
- Accepting delays to avoid unnecessary risk
Amateur pilots attempting this same flight might have departed during marginal conditions, encountering ice accumulation in an unequipped aircraft, or fighting gusty crosswinds beyond their skill level at destination.
How Commercial Airlines Use Weather Data for Operations
Commercial airline operations involve sophisticated weather analysis beyond individual pilot decision-making. Airlines employ meteorology departments staffing 10-30 forecasters monitoring weather 24/7, coordinating with dispatchers to optimize flight safety and efficiency.
Airline Operations Center Weather Integration
Major carriers operate Network Operations Centers (NOCs) integrating weather data into real-time operational decisions:
Flight Planning and Dispatch: Before every flight, dispatchers collaborate with pilots through computerized flight planning systems incorporating:
- Current and forecast weather along entire route
- Winds aloft optimization for fuel efficiency
- Turbulence forecasts for passenger comfort
- Convective weather avoidance routing
- Alternate airport weather verification
- Fuel reserves for weather contingencies
United Airlines’ NOC in Chicago processes weather data for 4,900+ daily flights, making 1,200-1,500 route modifications daily based on weather. Delta’s operations center in Atlanta employs 25 meteorologists providing forecasts customized beyond AWC products, particularly for international routes where US forecasting coverage diminishes.
Proactive Cancellation Strategy: Airlines increasingly cancel flights 4-8 hours before departure when weather forecasts indicate operational disruptions. This prevents:
- Aircraft and crews from being stranded at weather-affected airports
- Passenger connections disrupting at hub airports
- Costly diversions burning extra fuel
- Crew duty-time violations from weather delays
The economic calculation favors preemptive cancellations. A cancelled flight costs airlines $8,000-$15,000 in passenger rebooking and compensation. A diverted wide-body costs $75,000-$150,000 in extra fuel, landing fees, passenger hotels, crew replacement, and aircraft repositioning.
Ground Delay Programs and Traffic Flow Management
When weather reduces airport capacity, the FAA implements Ground Delay Programs (GDP) spacing departures to match reduced arrival rates. Airlines use weather forecasts to:
- Identify likely GDP airports 6-12 hours ahead
- Reposition aircraft to alternate hubs avoiding delays
- Cancel flights strategically to minimize passenger disruption
- Adjust crew pairings preventing duty-time violations from delays
Chicago O’Hare operates at 240 arrivals/hour in clear weather but drops to 90-120 arrivals/hour in low ceilings requiring instrument approaches. When TAFs forecast afternoon thunderstorms, airlines begin adjusting schedules at 6 AM, canceling 10-15% of afternoon departures to prevent cascading delays.
Deicing Operations and Winter Weather
Winter weather creates complex operational challenges. Commercial aircraft require anti-icing fluid application before takeoff when frost, ice, or snow accumulates on wings. Airlines maintain meteorology-trained deicing coordinators determining:
- When to begin deicing operations (typically when precipitation starts or frost forms)
- Which deicing fluids to apply based on temperature and precipitation type
- Holdover timeshow long deicing fluid remains effective before reapplication needed
- Whether conditions exceed operational capability requiring cancellations
Type I deicing fluid (heated water/glycol mixture removing contamination) combined with Type IV anti-icing fluid (providing longer protection) costs $1,500-$4,000 per wide-body application. Incorrect weather assessment causing unnecessary deicing wastes millions annually, while inadequate deicing creates safety hazards.
Airlines track pilots’ PIREPs regarding deicing effectiveness, feeding this data back to meteorologists and deicing coordinators. If multiple crews report ice accumulation despite deicing, operations may suspend departures until precipitation intensity decreases or temperatures rise above freezing.
Future of Aviation Weather: AI and Enhanced Forecasting
Aviation weather forecasting undergoes rapid transformation through artificial intelligence, machine learning, and enhanced observation networks. The 2024-2026 period saw deployment of technologies fundamentally improving forecast accuracy and lead times.
AI-Driven Turbulence Prediction
The FAA’s Graphical Turbulence Guidance (GTG) system implemented machine learning algorithms in 2025, analyzing:
- Winds aloft patterns indicating jet stream turbulence
- Atmospheric stability indices predicting convective turbulence
- Mountain wave patterns forecasting terrain-induced turbulence
- Historical PIREP data training models on actual turbulence locations
GTG accuracy improved from 67% (2023) to 79% (2025) for moderate-or-greater turbulence predictions. The system now provides 12-hour forecasts at 4,000-foot altitude increments, allowing airlines to route around turbulence zones proactively rather than reacting to PIREPs.
Economic impact proves substantial. Turbulence-related injuries cost airlines $200-$300 million annually in medical care, litigation, and aircraft inspections. American Airlines reported 41% reduction in turbulence injuries between 2023-2025 after implementing GTG-based routing, saving an estimated $18 million annually.
Space Weather Integration
Solar radiation storms affecting high-altitude polar routes now integrate into aviation weather products. Flights above 50,000 feet or routes above 78° latitude risk radiation exposure during solar events. The NOAA Space Weather Prediction Center coordinates with AWC to issue advisories when solar storms require:
- Route diversions to lower latitudes
- Altitude restrictions below 40,000 feet
- Flight cancellations during extreme solar events
Trans-polar routes between North America and Asia grew from 2,100 weekly flights (2020) to 3,400 weekly flights (2025) as airlines sought shorter routings. Space weather forecasting ensures these routes maintain safety standards despite increased solar radiation exposure at high latitudes.
Enhanced Satellite Capabilities
The GOES-T satellite launched in 2022 (operational as GOES-18 in 2023) provides visible and infrared imagery at 30-second intervals12x faster than previous satellites. This temporal resolution allows tracking of rapidly developing thunderstorms and monitoring storm intensification in near-real-time.
Advanced Baseline Imager (ABI) on GOES satellites detects:
- Cloud top cooling indicating strengthening updrafts
- Overshooting tops penetrating stratosphere (severe weather indicator)
- Lightning flash rates correlating with tornado potential
- Fog formation and dissipation patterns affecting airport operations
- Volcanic ash clouds from eruptions
The AWC’s Volcanic Ash Advisory Center (VAAC) uses satellite data to track ash clouds globally, issuing SIGMETs protecting aircraft engines from catastrophic damage. The 2010 Eyjafjallajökull eruption grounded European aviation for 6 days; 2025’s satellite capabilities would have enabled surgical airspace closures affecting 40-60% fewer flights while maintaining safety.
Automated Weather Observation Expansion
Automated Surface Observing Systems (ASOS) expanded from 900 sites (2020) to 1,180 sites (2025), increasing weather observation density across the US. These systems provide:
- Minute-by-minute updates versus hourly METAR schedule
- Automated remarks about precipitation type, thunderstorms, fog
- Present weather sensors detecting conditions without human observers
- Visibility sensors measuring slant-range visibility for approach assessment
The densification particularly benefits general aviation operating from non-towered airports. Small aircraft lacking sophisticated weather avoidance equipment depend on surface observations for VFR flight planning; additional ASOS sites provide critical weather data for 340+ previously unmonitored airports.
Numerical Weather Prediction Improvements
The National Weather Service’s Global Forecast System (GFS) model underwent major upgrades in 2024-2025:
- Resolution increased from 13km to 8km globally
- Forecast cycles extended from 16 days to 20 days
- Hourly output through 120 hours (previously 3-hour intervals)
- Enhanced tropical cyclone tracking and intensity forecasting
These improvements translate to better TAF accuracy, particularly for 12-24 hour forecasts that previously showed 65-70% accuracy but now achieve 75-80% accuracy. Pilots planning flights 24-48 hours ahead receive increasingly reliable forecasts, reducing weather-related cancellations while maintaining safety standards.
The National Weather Service provides comprehensive forecast models pilots and dispatchers analyze for flight planning beyond AWC products, particularly for long-range international operations.
Conclusion
The Aviation Weather Center serves as the cornerstone of flight safety, processing 847,000 daily observations into actionable weather intelligence for 45,000 US flights. Pilots integrate METARs, TAFs, SIGMETs, AIRMETs, winds aloft, radar, satellite imagery, and PIREPs into comprehensive weather assessments determining go/no-go decisions and in-flight routing.
Professional weather decision-making separates safe pilots from accident statistics. The 23% reduction in weather-related accidents between 2023-2025 reflects both improved forecasting technology and better pilot training emphasizing conservative decision-making over schedule pressure. As AI-driven prediction, enhanced satellites, and automated observation networks continue advancing, aviation weather forecasting will further reduce weather as a contributing accident factor while improving operational efficiency.
Understanding how pilots use Aviation Weather Center products provides passengers insight into weather-related delays and cancellations/decisions reflecting proactive safety management rather than operational failures. For more expert aviation insights, explore the complete guide library at TalkTravel’s blog.
Frequently Asked Questions
How often do pilots check weather before and during flights?
Pilots check weather 1-4 hours before departure for initial briefing, then monitor updates every 30-60 minutes until departure. During flight, crews receive weather updates every 15-30 minutes for routes longer than 2 hours, with continuous monitoring for destination conditions starting 45-60 minutes before arrival. Commercial aircraft with satellite weather receive real-time radar and updated forecasts throughout flight.
What is the difference between METARs and TAFs?
METARs report current observed weather conditions at airports, issued hourly with updates for significant changes. TAFs provide 24-30 hour forecasts for the same airports, issued four times daily. METARs answer “what is the weather now” while TAFs answer “what will the weather be.” Pilots use METARs to verify forecast accuracy and TAFs for flight planning and fuel calculations.
Can pilots fly through thunderstorms shown on weather radar?
No, pilots must avoid thunderstorms by at least 20 nautical miles for moderate cells and 40+ nautical miles for severe cells. Weather radar shows precipitation intensity but turbulence, hail, and lightning extend well beyond visible radar returns. Attempting to fly through or close to thunderstorms causes multiple fatal accidents annually and violates professional piloting standards.
What weather conditions will cancel or delay flights?
Flights delay or cancel for thunderstorms near airports, low ceilings and visibility below approach minimums, high crosswinds exceeding aircraft limits, heavy snow requiring extended deicing, severe turbulence along routes, and extreme temperatures affecting aircraft performance. Airlines often cancel proactively 4-8 hours before departure when forecasts show these conditions developing, preventing passengers from being stranded.
How accurate are aviation weather forecasts?
TAF accuracy varies by forecast period: 0-6 hours shows 85-90% accuracy for ceiling and visibility, 12-18 hours drops to 70-75% accuracy, and 24+ hours achieves 60-65% accuracy. Winds aloft forecasts prove 80-85% accurate within 10 knots for the first 12 hours. SIGMET and AIRMET warnings demonstrate 75-80% accuracy for severe weather occurrence, with some false alarms accepted to prevent missed warnings.
Do pilots need special training to interpret aviation weather?
Yes, all pilot certificates require weather theory training and practical application testing. Private pilot training includes 10-15 hours of weather instruction covering METARs, TAFs, weather charts, and decision-making. Instrument rating adds 15-20 hours focusing on IFR weather minimums, icing, and low-visibility operations. Commercial pilots receive advanced training in weather system analysis, and airline transport pilots undergo recurrent weather training annually.
What is the most dangerous weather condition for aircraft?
Embedded thunderstorms (storms hidden within cloud layers invisible to pilots) and severe icing pose the greatest threats. Embedded thunderstorms kill pilots who cannot see and avoid them, while severe icing accumulates faster than deicing systems can remove it, causing loss of control. Clear air turbulence near jet streams ranks third, creating severe turbulence without visible warning. All three conditions require proactive avoidance using Aviation Weather Center products rather than reactive responses after encountering hazards.